Demand of all macroeconomic subjects of the economy. Macroeconomics as a Science. Aggregate demand and aggregate supply. Aggregate demand and its components. Theoretical approaches to substantiating the type of the aggregate demand curve
2. Keynesian consumption function. Modern consumption theories (hypothesis “ life cycle"F. Modigliani, S. Kuznets and the" riddle of consumption ", the hypothesis of" constant income "by M. Fridman).
3. Consumer demand and saving: Keynesian and neoclassical saving functions.
4. The relationship between savings and investments.
Basic concepts a student should know
Aggregate demand(aggregate demand, AD) Is the total amount of goods and services that households, businesses, the state and abroad intend to buy at different price levels in the country.
AD = C + Ig + G + EXn
Price factors the dynamics of aggregate demand that explain the negative slope AD (curve slide AD):
Consumption (C) -the process of individual and / or sharing of benefits to meet needs.
Personal consumption expenditures include household expenditures for current consumption, durable goods, doctors, lawyers, teachers, etc.
Research in this area belongs to an English economist John Maynard Keynes (1883-1946):
1. Real consumption (ie, consumption adjusted for inflation) depends on current real incomes and changes with changes in the latter: C \u003d C (Y);
2. The "basic psychological law" of society: consumption grows, but not in the same proportion as income increases. As a result, the share of consumption in income decreases.
Consumer expenses are divided into:
1) autonomous (autonomous consumption expenditures, CA), independent of the current disposable income;
2) derivatives - depending on the dynamics of the current disposable income.
Disposable income (Yd) - comprehensive income (Y) net of taxes (T).
Saving (savings, S) are defined as household income minus consumption. Aggregate savings (S) are subdivided into private ( Sp), state ( Sg) and savings of the outside (rest) world ( Sr):
S \u003d Sp + Sg + Sr
Private savings are equal to the amount of income ( Y), transfers (transfers TR), interest on public debt (debt, D) net of taxes ( T) and consumption ( C):
Sp \u003d (Y + TR + D-T) - C
Government savings are defined as:
Sg \u003d (T-TR-D) - G
The negative value of government savings indicates the presence of a budget deficit (budget deficit, BD): BD \u003d - Sg
The savings of the outside world (the rest of the world) are equal to the income that the outside world receives through imports ( IM), minus export costs ( EX):
Sr \u003d IM - EX \u003d - EXn
TO factorsdetermining the dynamics of investments include:
3) the level of taxation;
4) changes in production technology;
5) cash equity capital;
6) economic expectations;
7) the dynamics of total income.
Investments are a function of the interest rate (rate, r): the higher the interest rate, the lower the investment level:
The most important macroeconomic proportions, reflecting the interaction of investment, savings and income, can be presented as follows (while abstracting from government spending and net exports):
If C + I \u003d C + S, then I \u003d S
Investments are functions of the interest rate: I \u003d I (r), and savings are a function of income: S \u003d S (Y).
Equality of investment and savings demonstrates the importance of maintaining certain proportions in the economy for the balance between aggregate demand and aggregate supply (it should be noted that this equality is not automatically observed).
Typical tasks
PROBLEM No. 17.The consumption function C \u003d 50 + 0.7Yd is given. Present the amount of savings as a function of income before tax, if the rate income tax equal to 13%. Yd is disposable income (net of taxes).
PROBLEM No. 18.The relationship between the value of national income and consumption of households is given by the table:
Define:
1) the algebraic form of the Keynesian consumption function;
2) at what income are savings equal to zero?
PROBLEM No. 19.Household consumption function C \u003d 40 + 0.75Yd Determine the amount of savings if the income tax rate is 20%, and the total household income is 300 den. units Yd is disposable income (net of taxes).
TASK No. 20.The economy is represented by the data in the table. Calculate private savings, government savings.
D) real money supply.
4. What non-price factors shift the aggregate demand curve upward;
C) excess of imports over exports;
5. The aggregate demand curve will shift to the right if:
A) the price level will rise;
B) purchases of imported goods will increase;
C) consumer spending on consumption will increase;
D) there will be a drop in production volumes.
6. All of the following shifts the aggregate demand curve to the right, except:
A) growth of public procurement;
C) growth of the nominal money supply;
D) tax cuts.
7. What non-price factors shift the aggregate demand curve downward:
A) decrease in public procurement;
B) reducing the tax burden;
C) increase in buyers' income;
D) optimistic expectations of buyers.
8. A shift in the aggregate demand curve cannot reflect:
A) an increase in the level of prices and the real volume of GNP at the same time;
B) an increase in the price level in the absence of growth in the real volume of GNP;
C) growth in real GNP in the absence of price increases;
D) an increase in the price level and a fall in the real volume of GNP at the same time.
9. Consumption is:
A) part of household income spent on the purchase of goods and services in the current period;
B) a part of income intended for the purchase of goods and services in the future period;
C) the balance of income accumulated in bank accounts;
D) all answers are wrong.
10. Savings are:
A) all accumulated property of households and savings of the population;
B) real cash balances of all market entities;
C) part of income invested in securities;
D) part of household income not spent in a given period of time.
11. What is meant by autonomous consumption:
A) the level of consumption is below the equilibrium state;
B) the level of consumption, which makes it possible to save;
C) consumption, which does not depend on income;
D) a part of income going to consumption.
12. The change in the value of autonomous consumption can be graphically represented as:
A) moving along the curve of planned costs;
B) changing the angle of the slope of the curve of planned costs;
C) a shift in the curve of planned costs;
D) moving along the curve of the consumption function as the level of income changes.
13. If the amount of consumer spending is 9,000, while disposable income is 10,000, then the marginal propensity to consume is:
D) is an undefined value.
14. What happens to МРС and МРS when the incomes of the population increase:
A) MRS\u003e 0; MPS< 1;
B) MPC and MPS increase;
C) МРС decreases, МРS increases;
D) cannot be said definitely.
15. A high marginal propensity to save means that:
A) the aggregate demand curve is steeper;
B) the aggregate demand curve is flatter;
C) the aggregate demand curve is flat if MPS is more than 0.5;
D) has no relation to aggregate demand.
16. Which of the following factors affect investment demand:
A) interest rate;
B) the expected rate of net profit;
C) optimism or pessimism of entrepreneurs;
D) all of the above factors.
17. What underlies the induced investment:
A) constantly increasing consumer demand;
B) scientific and technological progress;
18.What is the reason for the emergence of induced investment:
A) with an increase in national income and aggregate demand;
B) with population growth;
C) with the need to implement a technical innovation;
D) with the development of new deposits of minerals.
19. In an economic downturn:
A) the ratio between investment and savings is 1;
B) the volume of savings is equal to the volume of investments;
C) investment consumption is lower;
D) all answers are wrong.
20. If households do not spend all of their income on consumption and put the unspent amount in the bank, then we can say that they:
A) both save and invest;
B) save, but do not invest;
C) invest, but do not save;
D) do not save or invest;
E) save, but do not invest part of the savings that is used to purchase valuable papers.
Issues for discussion
1. Can the marginal propensity to consume be equal to the marginal propensity to save?
2. Do you agree with the basic psychological law of J. Keynes? What factors can influence the specific forms of its implementation?
3. What is the essence of the disagreements between Keynesians and the classics on the question of the decisive factor determining the dynamics of savings? Can savings be inversely related to the dynamics of the interest rate?
4. What, in your opinion, is the practical significance of identifying the parameters of consumer spending in a particular country at one or another stage of its development?
5. Explain, using an example, the negative functional dependence of the amount of investment and the bank interest rate?
Educational literature
1., Seregina: textbook / ed. Doctor of Economics, prof. ; Moscow State University ... - 8th ed., Rev. and add. [Text] - Moscow: Delo and Service Publishing House, 2007. - 496 p. - ("Textbooks of the Moscow State University.") - ISBN 978-5-8018-0332-6, Chapters 4.5;
2. Course of economic theory: textbook - 7th ed., Add. and revised [Text] - Kirov: ASA, 2011. - 880 p. - ISBN 978-5-85271-287-5, Chapter 18;
3. Macroeconomics: textbook for bachelors / [and others]; ed. ; Higher. shk. economy, Nat. issled. un-t. - M.: Yurayt, 2011 .-- 522 p. - ISBN 978-5-9916-1328-6, Chapter 3;
4. Mankiw Macroeconomics. 4th ed. / Per. from English. [Text] - SPb .: Peter, 2010. - 544 p. - ISBN 978-5-91180-167-0, Chapters 5, 7;
5. Tarasevich: textbook /,. - 7th ed., Rev. and add. [Text] - M .: Higher education, Yurayt-Izdat, 2009. - 654 p. (Universities of Russia) - ISBN 978-5-9692-0371-6, Chapter 3.
It has long been noted that the amount of goods that buyers request from sellers for purchase (let's call it the amount of demand), directly depends on the price level at which such a purchase is possible. The quantity demanded is the quantity of a specific product (in natural measurement), which buyers are ready to purchase over a period of time (month, year) at a certain price level of this product. Economists called the dependence of the value of purchases on the commodity market on price levels demand. Demand, the dependence of the value of demand in the commodity market on the prices at which goods can be offered for sale, which has developed in a certain period of time. Demand characterizes the state of the market, or rather one of its most important components of the economic logic of buyers' behavior. In reality, this logic manifests itself in the amount of demand (the number of purchases) at a given price level. By studying how buyers react to changes in the prices of goods, economists formulated the law of demand. The essence of the law of demand is that an increase in prices usually leads to a decrease in the amount of demand, and a decrease in prices to an increase (all other things being equal). The manifestation of the law of demand is associated with a number of important circumstances. People buy the overwhelming majority of goods by evaluating the price-utility ratio for each specific good. If a person's need for this good is not fully satisfied, then a decrease in price leads to an increase in the assessment of the relative desirability of the good. This means that it leads to an increase in demand for it. This regularity of changes in the desirability of a good (good) leads to the fact that although a decrease in price allows a buyer to purchase a larger amount of a product, the desirability of each additional unit becomes less and less due to the gradual saturation of the needs of buyers for these goods.
What other factors, besides the usefulness of the product and its price, affect the formation of demand? There are five such factors: income of buyers; prices for complementary or replacement products; expectations regarding future price dynamics; the number and age of buyers; habits, tastes, traditions and preferences of customers. In addition, demand can be influenced by some other factors (seasonality, government policy, income distribution, advertising, etc.).
We now turn directly to the concept of aggregate demand. We can say that the aggregate demand (AD) is the sum of all individual demands for the final goods and services offered on the commodity market. This also implies the following: aggregate demand is a model representing different volumes of goods and services (i.e., the real volume of production) that consumers can and are ready to purchase at any price level.
The buyers in the market of goods are four macroeconomic entities: households, firms, government and foreign countries.
Household demand dominates the market for goods. It accounts for more than half of the final aggregate demand. Observing the behavior of households, we can state that the factors that determine their demand in the market for goods include:
- 1) income from participation in production;
- 2) taxes and transfer payments;
- 3) the size of the property;
- 4) income from property. Taking into account that the household sector is an aggregate value, two more should be added to the named factors:
- 5) the degree of differentiation of the population by income level and size of property and
- 6) the size and age structure of the population.
The first two of the listed number of factors are combined into the concept of "disposable income". The last two are exogenous parameters in a short period. Depending on which of the remaining factors - disposable income, size of property or its profitability - is considered the most significant, it is possible to construct several varieties of the household demand function in the goods market, which is called the "consumption function".
State demand. The state buys products made in the private sector for the production of public goods. Against the background of the historical development of the market economy, there is a pronounced tendency towards an increase in the state's share in the gross product.
Since the economic activity of the state, in contrast to the economic activity of the private sectors, does not have a clearly expressed criterion of optimality, it is difficult to single out the main factors that uniquely determine the volume of government spending. The state budget the country is approved by the parliament, as a rule, a year ahead, and thus the main expenditure items of the state are set.
In addition to the direct influence of the state on the market of goods through their purchase, it indirectly affects the aggregate demand through taxes and loans (issuing bonds). With a change in the size of taxes, the size of disposable income changes, and, consequently, the consumer demand of households. State operations in the securities market are reflected at the level real rate percent and, as a consequence, on the investment demand of entrepreneurs.
Overseas demand. The demand abroad in the market for the goods of a country determines the volume of exports of the latter and depends mainly on the ratio of prices for domestic and foreign goods and the exchange rate of national currencies. Both of these factors are combined in the "real terms of exchange" indicator. It shows how many foreign goods a country can receive in exchange for a unit of its good. When in grows, they say that the real conditions of exchange of the country are improving, since for a unit of domestic good you can get more foreign ones. However, for foreign countries, this means a rise in the price of goods from this country, and the export of the latter, other things being equal, will decrease. Abroad not only buys, but also sells goods in the market of a given country. In the models designed to determine the conditions for achieving equilibrium in the national economy (internal equilibrium), for the sake of simplicity, it is assumed that the volume of supply abroad in the national market of goods is completely elastic, i.e., at a given price level, foreign countries satisfy any volume of demand of the inhabitants of a given country for imported goods. For simplicity, it is also assumed that only consumer goods are imported.
The volume of household demand for imported goods is determined by the same factors as the volume of demand for domestic goods.
Investment demand is the most volatile part of the aggregate demand for goods. Investments are most responsive to changes in the economic environment. On the other hand, it is precisely the change in the volume of investments that is most often the cause of market fluctuations.
The specificity of the impact of investments on the economic situation is that at the moment of their implementation, the demand for goods will increase, and the supply of goods will increase only after some time, when new production capacities come into operation.
Depending on what factors determine the volume of demand for investment, the latter are divided into induced and autonomous.
Induced investment. Investments are called induced if the reason for their implementation is a steady increase in demand for goods.
When the demand for goods increases at full load of production capacities used with optimal intensity, then at first additional products can be produced due to more intensive operation of existing equipment. But if the increased demand persists for a long time, then it is in the interests of entrepreneurs to increase production capacity in order to manufacture additional products at the lowest cost.
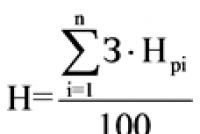
To determine the investment required to meet increased demand for the expansion production base, you need to know the incremental capital intensity of production - a coefficient showing how many units of additional capital are required to produce an additional unit of output.
Thus, induced investment is a function of national income growth. The capital gain ratio is also called an accelerator. With a uniform increase in national income, the volume of induced investment is constant. If income grows at a variable rate, then the volume of induced investment fluctuates. In the event of a decrease in national income, investments become negative.
Offline investment. However, entrepreneurs often find it profitable to make investments with a fixed national income, that is, with a given aggregate demand for goods. First of all, these are investments in new equipment and improvement of product quality. Such investments most often themselves cause an increase in national income, but their implementation is not a consequence of an increase in national income, and therefore they are called autonomous.
In Keynesian theory, aggregate demand is calculated by the formula
C– total personal consumption expenditures;
Jg - gross domestic private investment;
Xn is the volume of net exports;
G– government procurement of goods and services.
The aggregate demand model, presented as a curve, shows the different volumes of goods and services that consumers, businesses and government are willing to buy at any possible price level.
Aggregate demand model
There is an inverse relationship between the price level and the volume of national production. All other things being equal, the lower the price level, the greater the real volume of national production that will be bought by consumers inside the country, as well as abroad.
Non-price factors of aggregate demand include:
- 1. Changes in consumer spending (C):
- a) consumer welfare;
- b) consumer expectations;
- c) consumer debt;
- d) taxes.
- 2. Changes in investment costs (Jg):
- a) interest ratesthat change regardless of the price level;
- b) expectation of profit from investments;
- c) corporate taxes;
- d) technology;
- e) excess capacity.
- 3. Government spending: government purchases of goods and services (G).
- 4. Expenditures on net exports (Xn): which, in turn, depend on the national income of other countries, on the competitiveness of domestic goods and on the exchange rate of the national currency.
The first non-price factor is a change in consumer spending, not related to a change in prices. An increase in real income or consumer expectations for an increase in income can lead to an increase in aggregate demand. The inflationary rise in prices expected by the consumer and the increase in taxes lead to a decrease in aggregate demand. Consumer indebtedness (purchases on credit) also changes the volume of aggregate demand: a high level of consumer indebtedness can force him to reduce operating expenses in order to pay off debt, and this will reduce the volume of aggregate demand. The following factors affect the change in consumer spending:
Consumer welfare. Tangible assets consist of all the assets that consumers own: financial assets, such as stocks and bonds, and real estate (houses, land). A sharp decrease in the real value of consumers' assets leads to an increase in their savings (to a decrease in purchases of goods) as a means of restoring their well-being. As a result of the reduction in consumer spending, aggregate demand decreases and the aggregate demand curve shifts to the left. Conversely, as a result of the increase in the real value of material assets, consumer spending at a given price level increases. Therefore, the aggregate demand curve shifts to the right. IN in this case we do not mean the wealth effect discussed earlier, or the effect of real cash balances, which assumes a constant aggregate demand curve and is a consequence of changes in the price level. In contrast, changes in the real value of the material assets in question do not depend on changes in the price level; it is a non-price factor that shifts the entire aggregate demand curve.
Consumer expectations. Changes in the nature of consumer spending depend on the predictions made by consumers, for example, when people believe that their real income will increase in the future, they are willing to spend most your current income. Consequently, at this time, consumer spending increases (savings at this time decrease) and the aggregate demand curve shifts to the right. Conversely, if people believe that their real incomes will decrease in the future, then their consumption expenditures and, consequently, aggregate demand will decrease.
Consumer debt. The high level of consumer debt, resulting from previous purchases on credit, can force him to reduce today's expenses in order to pay off existing debts. As a result, consumer spending will shrink and the aggregate demand curve will shift to the left. Conversely, when consumers are relatively low in debt, they are willing to increase their spending today, leading to an increase in aggregate demand.
Taxes. A decrease in income tax rates entails an increase in net income and the number of purchases at a given price level. This means that tax cuts will shift the aggregate demand curve to the right. On the other hand, tax increases will cause a decrease in consumer spending and a shift in the aggregate demand curve to the left.
The second factor is the investment costs of the business. An increase in business investment costs leads to an increase in aggregate demand, and vice versa, a decrease in such costs leads to a decrease in aggregate demand. The reasons for the increase in the size of investments can be: a decrease in the interest rate, the expected increase in profits, tax cuts, the acquisition of new technologies (which reduces costs and increases profits) and reserve capacity of the enterprise (an increase in excess capacity at the enterprise will reduce investment costs).
Interest rates. All other things being equal, an increase in the interest rate caused by any factor other than a change in the price level will lead to a decrease in investment costs and a decrease in aggregate demand. In this case, we do not mean the so-called interest rate effect that occurs as a result of price level changes.
The expected return on investment. More optimistic projections for returns on capital invested increase the demand for investment goods and thereby shift the aggregate demand curve to the right. For example, an anticipated rise in consumer spending may, in turn, stimulate investment in the hope of future profits. Conversely, if the prospects for obtaining profits from future investment programs are rather vague due to the expected decrease in consumer spending, then investment costs tend to decrease. Consequently, aggregate demand will also decrease.
Business taxes. An increase in business taxes will lead to a decrease in corporate profits (after deducting taxes) from capital investments, and, consequently, to a decrease in investment costs and aggregate demand. Conversely, tax cuts would increase profits (after taxes) on capital expenditures and possibly increase investment spending as well as push the aggregate demand curve to the right.
Technologies. New and improved technologies tend to stimulate investment spending and thereby increase aggregate demand.
Excess capacity. An increase in excess capacity, that is, available unused capital, constrains demand for new investment goods and therefore reduces aggregate demand. Simply put, underperforming firms do not have the incentive to build new factories. Conversely, if all firms find that their excess capacity is decreasing, they are ready to build new factories and buy more equipment. Consequently, investment spending increases and the aggregate demand curve shifts to the right.
And two more non-price factors affect the change in aggregate demand - government spending (direct dependence of aggregate demand on this factor) for procurement finished goods and services. An increase in government purchases of the national product at a given price level will lead to an increase in aggregate demand as long as tax levies and interest rates will remain unchanged. Conversely, a decrease in government spending will reduce aggregate demand.
And net export costs. When we talk about the levers that shift aggregate demand, we mean changes in net exports caused not by changes in the price level, but by other factors. The increase in net exports (exports minus imports) brought about by these "other" factors shifts the aggregate demand curve to the right. The logic of this statement is as follows. First, higher levels of national exports create higher demand for American goods overseas. Second, the reduction in our imports implies an increase in domestic demand for domestically produced goods. First of all, the volume of net exports change the national income of foreign countries and exchange rates.
National income of other countries. An increase in the national income of a foreign state increases the demand for the goods of our country and therefore increases the aggregate demand in our country. Since when the income level is foreign countries rises, then their citizens get the opportunity to buy more goods, both domestically produced and produced in our country. Consequently, our exports increase along with the rise in the national income of our trading partners. A decline in national income abroad has the opposite effect: our net exports are shrinking, shifting the aggregate demand curve to the left.
Exchange rates. Changes in the exchange rate of the dollar against other currencies are the second factors that affect net exports and, therefore, aggregate demand.
As a result of studying the materials in this chapter, students should:
know
- equilibrium problems in the markets for goods and services, financial assets, labor;
- the specifics of the formation of supply and demand in a given set of markets;
be able to
Provide a theoretical basis for the mechanism for establishing equilibrium in the long and short term;
own
- skills in graphic interpretation of theoretical positions;
- graphic analysis skills.
Market of goods and services
16.1.1. Aggregate demand and its components. Theoretical approaches to substantiating the type of the aggregate demand curve
The aggregate demand in the market for goods and services reflects the plans of all economic entities regarding purchases of all volumes of final goods produced in the country over a certain period of time.
The dependence of the planned volumes of purchases of final goods and services produced in the country on the price level is reflected in the aggregate demand curve.
All points on this curve show what volume of final goods and services all economic entities are ready to buy at the planned price level.
The demand curve is built on the assumption that all factors, except the price level, are constant. A change in non-price factors leads to a shift in the aggregate demand curve. Usually the aggregate demand curve is decreasing dependence on price level (fig.16.1).
Figure: 16.1.
Here are some concepts to explain the decreasing type of aggregate demand.
![]()
Assessing the behavior of economic agents in the formation of plans to purchase goods and services, Keynes believed that the elasticity of aggregate demand is determined by the sensitivity of investments to changes in the interest rate as a result of price fluctuations.
Keynes highlighted interest rate effect(Keynes effect). When prices rise ( R) the demand for money increases, which, given the supply of money, leads to an increase in the interest rate. In response to an increase in the interest rate ( i) the volume of planned investments ( I) is reduced.
A decrease in investment demand leads to a decrease in aggregate demand. Since, according to Keynesian theory, the income function is low-elastic in i, then the entire aggregate demand is low elastic.
Considering aggregate demand low elastic in price, Keynes believed that aggregate demand is more sensitive to income growth, and often used the planned expenditure curve (Figure 16.2):
![]()
Planned cost curve is the functional dependence of the total planned expenditures on the level of national income Y.
4. Representatives of the neoclassical synthesis, developing Keynes's idea of \u200b\u200banalyzing the sensitivity of all elements of aggregate demand to price changes, in addition to the Keynes effect, considered two more effects of increasing the price elasticity of aggregate demand.
The effect of real cash balances (Pigou effect): Consumer spending can also be price sensitive.

Figure: 16.2. Planned cost curve(A - autonomous costs)
When prices rise ( R) consumers are faced with the fact that their savings (5) are depreciating, they become poorer, the desire to maintain the level of well-being forces economic agents to increase savings by reducing consumption. Empirically, the Pigou effect is weak.
State procurements (G) not sensitive to price changes.
Effect of import purchases... When prices rise ( R) in a given country, all goods and services become more expensive in comparison with imported goods. As a result, the subjects of a given country begin to prefer imported goods. At the same time, foreign firms reduce the volume of export purchases, net exports (NX) goes down.
16.1.2. Aggregate supply in the long and short term
In macroeconomics, different postulates are used to define the concept of short-term and long-term periods than in microeconomics. In macroeconomics, all but one factor is assumed to be constant. The change in all factors takes place only in ultra-long periods. The division into short-term and long-term periods is based on price flexibility.
Under short term means the period during which the prices of resources (for example, wage) do not have time to adapt to changes in commodity prices. Long term - the period during which all resource chains fully adjust to changes in commodity prices.
The dependence of producers' plans on the price level is described aggregate supply curve.
Aggregate supply - the entire volume of final goods and services that the producers of a given country are ready to produce and put on the market within a certain period of time.
The length of the period has a large impact on the appearance of the aggregate supply curve. There are two types of aggregate supply curves representing short and long run dependencies.
IN long term the aggregate supply curve is a vertical line passing at the level of national income at full employment ( YF) (fig.16.3).

Figure: 16.3.
Resource price flexibility explains the vertical appearance of the curve. The entrepreneur achieves the optimal output, and when his costs in the long run grow in the same proportion as the price level, it makes no sense for him to change this volume.
Long-term resource price flexibility allows the employer to pay workers wages that keep full employment in the economy.
IN short term the premise of flexibility in resource prices is not met, the short-term aggregate supply curve (AScr) differs from the long-term aggregate supply curve (ASdl).
In the case when all resource chains are constant, and the production function allows the entrepreneur to attract new workers without changing labor productivity, the aggregate supply curve (CSP) will be horizontal (Figure 16.4).
In general terms, the aggregate supply curve in the short run is an increasing function of the price level (Fig. 16.5).

Figure: 16.4.

Figure: 16.5.
In modern economic theory, there are four concepts that explain the shape of the rising aggregate supply curve. Two concepts focus on the imperfection of the labor market, two - on the imperfection of the market for goods.
Each model identifies a specific reason why an unexpected change in prices causes fluctuations in the volume of goods produced.
16.1.3. The mechanism of adaptation of the economic system to short-term and long-term equilibrium in the market of goods
Macroeconomic equilibriumthe market for goods and services is observed when the volume of national production coincides with the planned costs of purchasing it, i.e. when the aggregate demand (SS) is equal to the aggregate supply (SP). Macroeconomic equilibrium does not mean that demand is equal to supply for each specific type of goods. It can be accompanied by imbalances in certain commodity markets. In this case, the deficit in some sectoral markets must be covered by the surplus in others so that aggregate demand is equal to aggregate supply.
Distinguish between short-term and long-term macroeconomic equilibrium.
Short termequilibrium is less stable, since in a market economy there are internal reasons, motives that bring it out of equilibrium for a certain period. Long termthe balance is more stable.
Let us briefly consider the reaction of the economic system to the imbalance in conditions when there is an increase in aggregate demand. Assumption: the economy is initially in a state of long-term and short-term equilibrium (Figure 16.6).
For any reason, there was an increase in SS, a shift in aggregate demand AD0 to position AD1 (AD0 → AD1).
At a price Rthere will be a shortage on the product market d\u003e s at the rate of Y1 \u003e YF.
If wages remained tight, entrepreneurs began to raise prices in response to the increased demand ( R) and increase production.
The rise in prices reduced the value of CC, and at the point E1 short-term equilibrium has been achieved, the volume of production is Y2.
In the long term, resource prices begin to rise. The increase in costs makes it unprofitable to keep production at the level Y2, therefore firms will reduce production at a given price level - there will be a shift in the CSP (AScr0 → AScr1).
The volume of production will decrease ( Y1 < Y2), the price level will increase ( R2 > R1). Dot E2 – new short-term equilibrium.
If entrepreneurs raise wages in line with the rise in prices, then there will be a further increase in production costs, which will lead to a shift in the CSP in the short term, the shifts will continue until the economy goes into a state of short and long term equilibrium.
By what amount will prices increase (from R0 to R3) depends on the elasticity of demand. The higher the elasticity of demand, the higher the inflation rate.
Price growth in the short term (from R0 to R1) depends on the elasticity of the corresponding PCB. The lower the elasticity of the joint venture, the greater the rise in prices in the short run.

Figure: 16.6.
The Russian economy is characterized by low elasticity of aggregate demand and aggregate supply in the short run.
Low elasticity of demand is predetermined by the fact that the entrepreneur's investment demand is insensitive to the interest rate due to the imperfection of the credit financing mechanism for investments.
Low elasticity of aggregate supply is associated with long-term sustained developing inflation.
In some cases, when the SS is practically inelastic, the country's economy with the growth of the SS can fall into inflation trap, i.e. a situation in which internal market forces are able to bring the economy to a state of stable long-term equilibrium, in which prices are practically stabilized. Aggregate demand is practically parallel to aggregate supply in the long run (Figure 16.7).

Figure: 16.7.
Shifts in the aggregate supply curve do not lead to an increase in prices; in this situation, in order to restore long-term equilibrium, government intervention (restoration policy) is required, aimed at reducing aggregate demand ( AD1→ AD0).
In the opposite situation, when the imbalance is caused by a decrease in aggregate demand (AD0 → AD2), with inelasticity of the SS, deflationary trap, expressed in the fact that the price level will fall, but at the same time the economy will have low employment. In a situation of a deflationary trap, the state introduces incentives for the SS until it returns to an equilibrium state.
Macroeconomics is a section of economic theory in which economic problems are investigated at the level of the national economy as a whole. The term "macroeconomics" itself has been used relatively recently, but macroeconomic analysis emerged almost simultaneously with economic science.
Already in the "Economic Table" F. Quesnay (1694-1774) presents a macroeconomic model of economic life. Elements of macroeconomic analysis are found in the works of A. Smith and D. Ricardo. Karl Marx widely used the macroeconomic approach in his theory.
In the twentieth century. J. Keynes played an outstanding role in the development of macroeconomic analysis. Macroeconomics as an independent scientific discipline was formed after the publication of J. Keynes's book "The General Theory of Employment, Interest and Money" in 1936. It presented a system of new concepts and categories for economic science, which the author used as tools for functional macroeconomic analysis.
There is no insurmountable divide between macroeconomics and microeconomics. In macroeconomic analysis, the basic concepts of microeconomics are used - the law of supply and demand and the theory of economic equilibrium. However, there are significant differences in objectives, goals and tools.
Macroeconomics studies general economic processes in general, i.e. conditions and results of activity on the market of all entities economic relations... Economic phenomena are considered by macroeconomics in their totality. The results of joint actions of participants in economic relations can be both positive and negative for individual agents and for the system as a whole. In this case, the state is called upon to correct economic relations. Government actions aimed at stabilizing and developing economic relations are called economic policy.
The state establishes the "rules of the game" in the national market: determines tax policy, tariff rates, quotas, subsidies, as well as laws according to which participants in economic relations operate. The state acts as one of the subjects of the market, i.e. an active party defending national interests. In the macroeconomic system, the state performs another function - the creation (supply) of money necessary to meet the needs of households, firms and the state itself.
With a macroeconomic approach, the national economy can be represented as a single market. Therefore, macroeconomic analysis involves the study of mass phenomena and processes, which, in their totality, reflect the relationships that develop in the market and affect all phases and spheres of production.
Consideration of general relationships and interdependencies within the economic system as a whole requires a corresponding aggregation of economic categories, i.e. use of aggregates.
The process of social production and reproduction presupposes economic equilibrium not only at the micro, but also at the macro level. The forms of this balance are diverse: it is the correspondence between resources and needs, production and consumption, between demand and supply, between material and financial flows.
It is customary to distinguish three kinds market economic equilibrium : partial, general at the microeconomic level, general at the macroeconomic level. Partial equilibrium Is the equilibrium in a particular market for a given product. General microeconomic equilibrium - this is an equilibrium in a single local market, a regional market for the entire set of goods sold on it.
General macroeconomic equilibrium is an equilibrium in all markets that are included in the economic system of the entire country as a whole in each this period time. This equilibrium is an indicator of the state of the economic system as a single integral organism, which includes an infinite variety of various connections and relationships.
Distinguish, perfectmacroeconomic equilibrium, which presupposes an optimal balance of connections and proportions, and real equilibrium, which develops taking into account the real internal and external factors affecting the system as a whole.
Macroeconomic equilibrium can be characterized using aggregate demand and aggregate supply.
Aggregate demandis the real volume of national production that all consumers (population, enterprises and governments) are ready to buy at one or another price level. Aggregate demand, in contrast to market demand, consists of four main components: the first is consumer demand for goods and services; the second is the investment demand of firms; the third is government procurement; the fourth is net exports, i.e. difference between export and import.
Aggregate supply is the value of the actually produced product by all producers in the economic system at a certain price level.
The intersection of the curves of aggregate demand and aggregate supply determines the equilibrium volume of output and the level of prices in the economy, characterizes the point of general macroeconomic equilibrium.
The problem of macroeconomic equilibrium is one of the most acute and controversial in economic science. It is necessary to name the most important prerequisites for general equilibrium in the economy. Equilibrium implies the alignment of social goals and social opportunities. The goals and priorities of social development are changing, the needs for resources are changing, and, consequently, there are changes in proportions, there is a need to ensure a new equilibrium state.
Economic equilibrium presupposes such a state of the economy when all economic resources countries. Equilibrium means that the overall structure of production is aligned with the structure of consumption.
Economic equilibrium is the coordinated, equilibrium development of all markets, i.e. markets for goods and services, work force, money, capital. It is achieved in the course of interaction and mutual adaptation of all spheres, elements, factors of production.
In modern economic science, there are two main concepts on the issue of macroeconomic equilibrium: neoclassical and Keynesian.
The neoclassical school considers a model of general economic equilibrium in conditions of perfect competition in the short term. The main thesis of this concept says: the supply of goods creates its own demand, the production volume of products automatically ensures the receipt of such income, which is sufficient for the full sale of all goods.
The followers of this theory in our time argue that the market economy does not need state regulation of aggregate demand and aggregate supply. A market economy is a self-regulatory system that automatically ensures that income and expenditure are equal in full employment. The instruments of self-regulation are prices, wages, interest rates, the fluctuations of which equalize supply and demand.
The Keynesian School believes that the economy is not developing smoothly, and wages, prices, and interest rates are not so flexible instruments that can quickly bring demand and supply to match at the macroeconomic level. Salaries based on formal legislation and contractual systems may not decline, and unemployment may rise. During a depression, a drop in aggregate demand will lead to a drop in production and a decrease in demand for labor.
Which of the options for macroeconomic equilibrium is more realistic? Positive analysis can be used to write off possible states of macroeconomic equilibrium. State officials and governments can solve specific macroeconomic problems and implement specific programs in the unique conditions of each individual country.
In macroeconomics, the AD-AS model is the basic one for studying fluctuations in the volume of output and the level of prices in the economy as a whole, the causes and consequences of their changes. It can be used to describe various options for the economic policy of the state.
Aggregate demand is the sum of all expenditures on final goods and services produced in the economy.
It reflects the relationship between the volume of aggregate output for which demand is presented by economic agents and the general level of prices in the economy. In the absence of strong inflation and production constraints, the growth in aggregate demand stimulates an increase in output and employment, with little impact on the price level. If the economy is close to full employment, then the growth of AD will cause not so much an increase in output as an increase in prices.
The structure of AD can be distinguished:
Demand for consumer goods and services;
The demand for investment goods;
State demand for goods and services;
Export demand from foreigners.
The aggregate demand (AD) curve shows the combinations of price level and output level at which commodity markets and asset markets are simultaneously in equilibrium. It is easy to obtain from the IS-LM model. Let us first turn to the graphical derivation of the aggregate demand curve. Having fixed prices at the P0 level, we find the corresponding equilibrium income Y0 and draw this point in the Y-P axes. Consider a lower price level P ’(P’
Fig. 7. Plotting AD Curve
The movement along the AD curve reflects the change in aggregate demand depending on the dynamics of the general price level. This relationship can be obtained from the equation of the quantitative theory of money:
MV \u003d PY, P \u003d MV / Y, Y \u003d MV / P.
The negative slope of the AD curve is explained as follows: the higher the price level, the smaller the real stocks of money (M / P), and, consequently, the smaller the quantity of goods and services for which demand is presented. The curve is constructed under the condition of a fixed supply of money and the speed of their circulation.
TO non-price factorsinfluencing AD includes anything that affects household consumption spending, firm investment spending, government spending, and net exports. These are: consumer welfare, their expectations, taxes and% rates, subsidies and soft loans to investors, fluctuations exchange rates, the supply of money and the speed of their circulation.